2.6 KiB
2.6 KiB
go-charts
![]()
![]()
go-charts base on go-chart,it is simpler way for generating charts, which supports svg and png format and three themes: light, dark and grafana.
Apache ECharts is popular among Front-end developers, so go-charts supports the option of Apache ECharts. Developers can generate charts almost the same as Apache ECharts.
Screenshot of common charts, the left part is light theme, the right part is grafana theme.
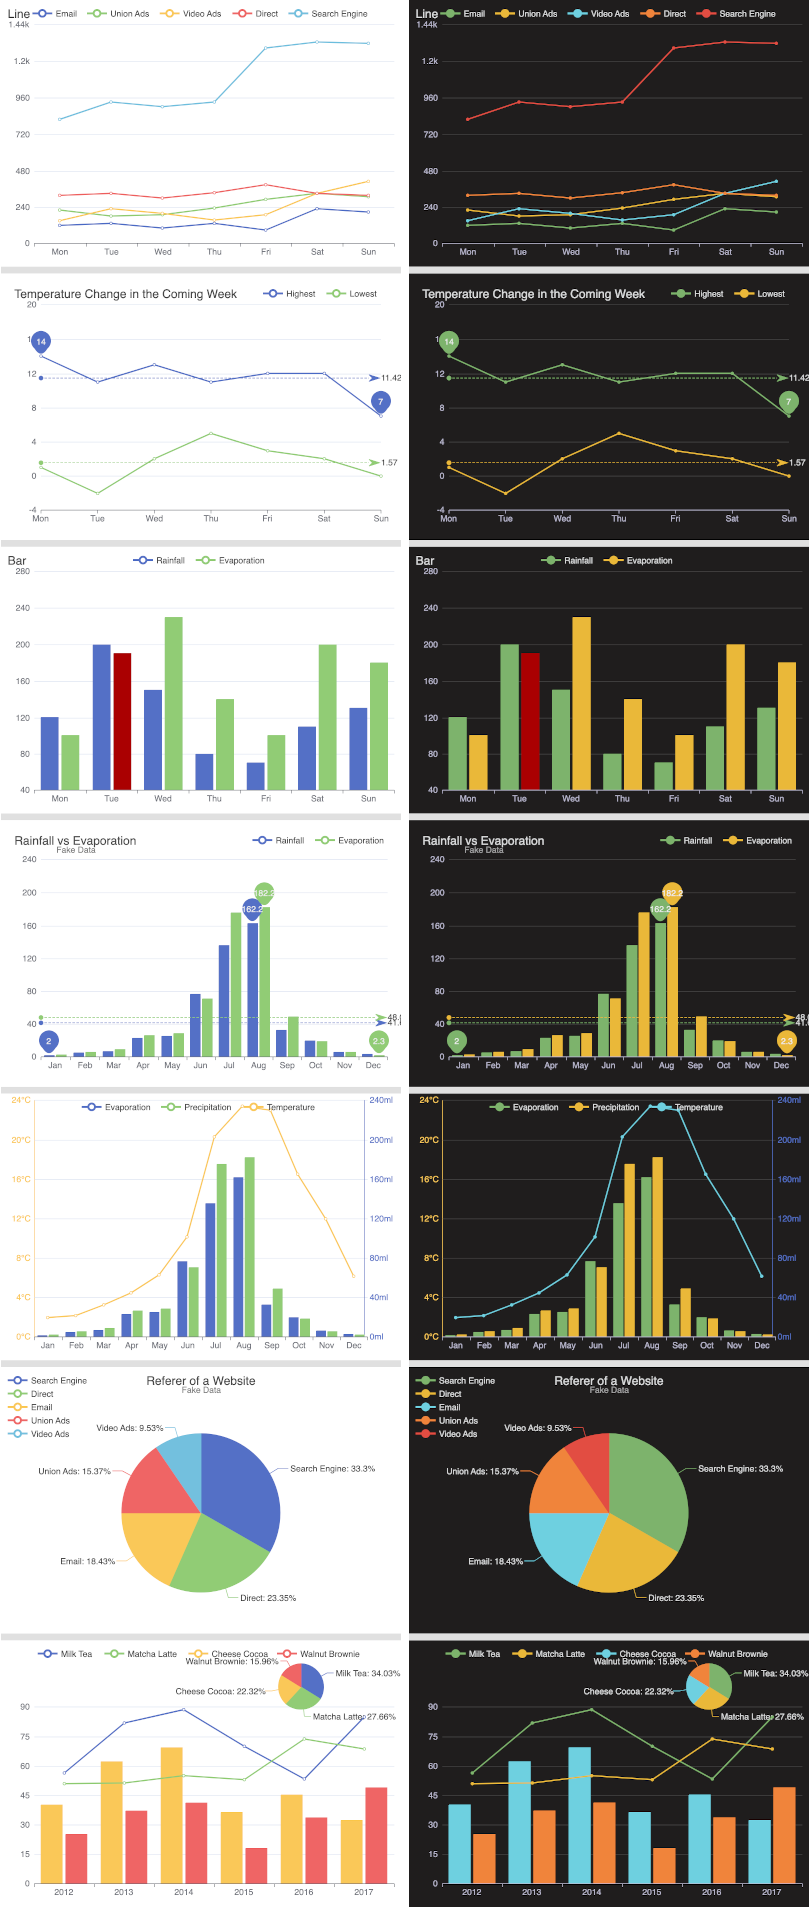
Chart Type
Support three chart types: line, bar and pie.
Example
The example is for golang option and echarts option, more examples can be found in the ./examples/ directory.
package main

import (
	"os"
	"path/filepath"

	charts "github.com/vicanso/go-charts"
)

func writeFile(file string, buf []byte) error {
	tmpPath := "./tmp"
	err := os.MkdirAll(tmpPath, 0700)
	if err != nil {
		return err
	}

	file = filepath.Join(tmpPath, file)
	err = os.WriteFile(file, buf, 0600)
	if err != nil {
		return err
	}
	return nil
}

func chartsRender() ([]byte, error) {
	d, err := charts.Render(charts.ChartOption{
		Type: charts.ChartOutputPNG,
		Title: charts.TitleOption{
			Text: "Line",
		},
		XAxis: charts.NewXAxisOption([]string{
			"Mon",
			"Tue",
			"Wed",
			"Thu",
			"Fri",
			"Sat",
			"Sun",
		}),
		SeriesList: charts.SeriesList{
			charts.NewSeriesFromValues([]float64{
				150,
				230,
				224,
				218,
				135,
				147,
				260,
			}),
		},
	})
	if err != nil {
		return nil, err
	}
	return d.Bytes()
}

func echartsRender() ([]byte, error) {
	return charts.RenderEChartsToPNG(`{
		"title": {
			"text": "Line"
		},
		"xAxis": {
			"data": ["Mon", "Tue", "Wed", "Thu", "Fri", "Sat", "Sun"]
		},
		"series": [
			{
				"data": [150, 230, 224, 218, 135, 147, 260]
			}
		]
	}`)
}

type Render func() ([]byte, error)

func main() {
	m := map[string]Render{
		"charts-line.png":  chartsRender,
		"echarts-line.png": echartsRender,
	}
	for name, fn := range m {
		buf, err := fn()
		if err != nil {
			panic(err)
		}
		err = writeFile(name, buf)
		if err != nil {
			panic(err)
		}
	}
}
Performance
BenchmarkMultiChartPNGRender-8                78          15216336 ns/op         2298308 B/op       1148 allocs/op
BenchmarkMultiChartSVGRender-8               367           3356325 ns/op        20597282 B/op       3088 allocs/op