Starts from https://github.com/vicanso/go-charts
| .github/workflows | ||
| assets | ||
| examples | ||
| .gitignore | ||
| axis.go | ||
| axis_test.go | ||
| bar.go | ||
| bar_chart.go | ||
| bar_chart_test.go | ||
| bar_test.go | ||
| chart.go | ||
| chart_test.go | ||
| draw.go | ||
| draw_test.go | ||
| echarts.go | ||
| echarts_test.go | ||
| font.go | ||
| font_test.go | ||
| go.mod | ||
| go.sum | ||
| legend.go | ||
| legend_test.go | ||
| LICENSE | ||
| line.go | ||
| line_chart.go | ||
| line_chart_test.go | ||
| line_test.go | ||
| Makefile | ||
| mark_line.go | ||
| mark_line_test.go | ||
| mark_point.go | ||
| mark_point_test.go | ||
| pie_chart.go | ||
| pie_chart_test.go | ||
| range.go | ||
| range_test.go | ||
| README.md | ||
| series.go | ||
| series_test.go | ||
| theme.go | ||
| theme_test.go | ||
| title.go | ||
| title_test.go | ||
| util.go | ||
| util_test.go | ||
| xaxis.go | ||
| xaxis_test.go | ||
| yaxis.go | ||
| yaxis_test.go | ||
go-charts
![]()
![]()
go-charts基于go-chart生成数据图表,支持svg与png两种方式的输出,支持三种主题light, dark以及grafana。
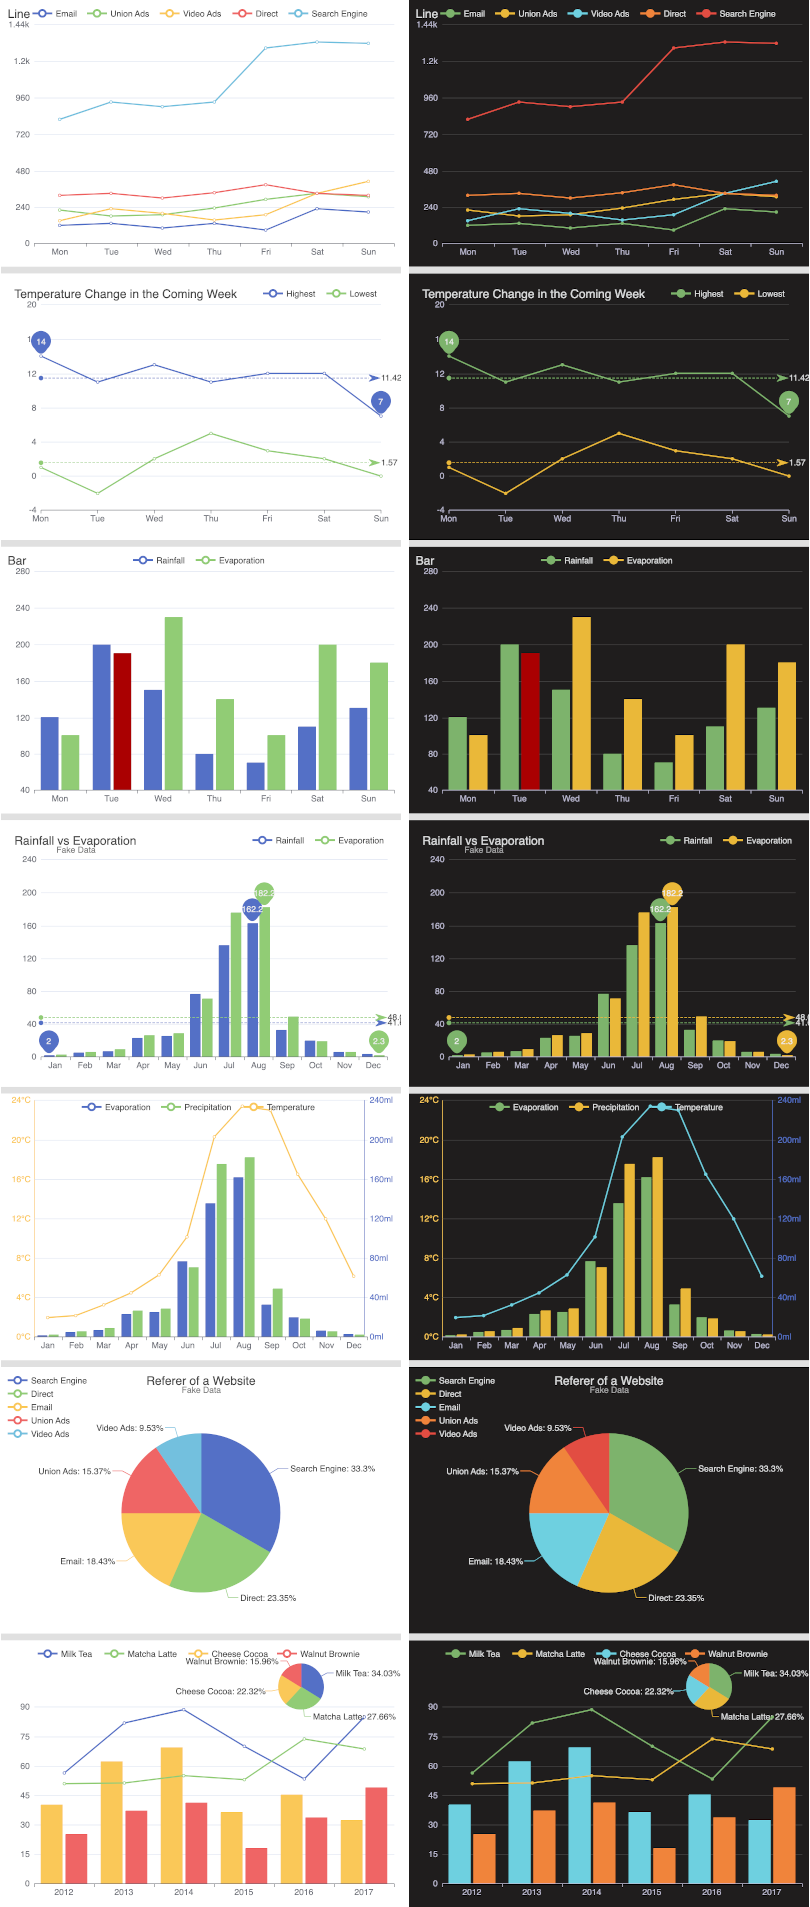
Apache ECharts在前端开发中得到众多开发者的认可,因此go-charts提供了兼容Apache ECharts的配置参数,简单快捷的生成相似的图表(svg或png),方便插入至Email或分享使用。下面为常用的图表截图(主题为light与grafana):
支持图表类型
暂仅支持三种的图表类型:line, bar 以及 pie
示例
下面的示例为go-charts两种方式的参数配置:golang的参数配置、echarts的JSON配置,输出相同的折线图。
更多的示例参考:./examples/目录
package main

import (
	"os"
	"path/filepath"

	charts "github.com/vicanso/go-charts"
)

func writeFile(file string, buf []byte) error {
	tmpPath := "./tmp"
	err := os.MkdirAll(tmpPath, 0700)
	if err != nil {
		return err
	}

	file = filepath.Join(tmpPath, file)
	err = os.WriteFile(file, buf, 0600)
	if err != nil {
		return err
	}
	return nil
}

func chartsRender() ([]byte, error) {
	d, err := charts.Render(charts.ChartOption{
		Type: charts.ChartOutputPNG,
		Title: charts.TitleOption{
			Text: "Line",
		},
		XAxis: charts.NewXAxisOption([]string{
			"Mon",
			"Tue",
			"Wed",
			"Thu",
			"Fri",
			"Sat",
			"Sun",
		}),
		SeriesList: charts.SeriesList{
			charts.NewSeriesFromValues([]float64{
				150,
				230,
				224,
				218,
				135,
				147,
				260,
			}),
		},
	})
	if err != nil {
		return nil, err
	}
	return d.Bytes()
}

func echartsRender() ([]byte, error) {
	return charts.RenderEChartsToPNG(`{
		"title": {
			"text": "Line"
		},
		"xAxis": {
			"data": ["Mon", "Tue", "Wed", "Thu", "Fri", "Sat", "Sun"]
		},
		"series": [
			{
				"data": [150, 230, 224, 218, 135, 147, 260]
			}
		]
	}`)
}

type Render func() ([]byte, error)

func main() {
	m := map[string]Render{
		"charts-line.png":  chartsRender,
		"echarts-line.png": echartsRender,
	}
	for name, fn := range m {
		buf, err := fn()
		if err != nil {
			panic(err)
		}
		err = writeFile(name, buf)
		if err != nil {
			panic(err)
		}
	}
}
ECharts参数说明
标记为[非echarts配置]的参数为新增参数,可根据实际使用场景添加。
type画布类型,支持svg与png,默认为svgtheme颜色主题,支持dark、light以及grafana模式,默认为lightfontFamily字体,全局的字体设置[非echarts配置]padding图表的内边距,单位px。支持以下几种模式的设置[非echarts配置]padding: 5设置内边距为5padding: [5, 10]设置上下的内边距为 5,左右的内边距为 10padding:[5, 10, 5, 10]分别设置上右下左边距
box图表的区域,以{"left": Int, "right": Int, "top": Int, "bottom": Int}的形式配置,[非echarts配置]width画布宽度,默认为600[非echarts配置]height画布高度,默认为400[非echarts配置]title图表标题,包括标题内容、高度、颜色等title.text标题文本,支持以\n的形式换行title.subtext副标题文本,支持以\n的形式换行title.left标题与容器左侧的距离,可设置为left,right,center,20%以及20这样的具体数值title.top标题与容器顶部的距离,暂仅支持具体数值,如20title.textStyle.color标题文字颜色title.textStyle.fontSize标题文字字体大小title.textStyle.fontFamily标题文字的字体系列,需要注意此配置是会影响整个图表的字体
xAxis直角坐标系grid中的x轴,由于go-charts仅支持单一个x轴,因此若参数为数组多个x轴,只使用第一个配置xAxis.boundaryGap坐标轴两边留白策略,仅支持三种设置方式null,true或者false。null或true时则数据点展示在两个刻度中间xAxis.splitNumber坐标轴的分割段数,需要注意的是这个分割段数只是个预估值,最后实际显示的段数会在这个基础上根据分割后坐标轴刻度显示的易读程度作调整xAxis.datax轴的展示文案,暂只支持字符串数组,如["Mon", "Tue"],其数量需要与展示点一致
yAxis直角坐标系grid中的y轴,最多支持两个y轴yAxis.min坐标轴刻度最小值,若不设置则自动计算yAxis.max坐标轴刻度最大值,若不设置则自动计算yAxis.axisLabel.formatter刻度标签的内容格式器,如"formatter": "{value} kg"yAxis.axisLine.lineStyle.color坐标轴颜色
legend图表中不同系列的标记legend.show图例是否显示,如果不需要展示需要设置为falselegend.data图例的数据数组,为字符串数组,如["Email", "Video Ads"]legend.align图例标记和文本的对齐,可设置为left或者right,默认为标记靠左leftlegend.paddinglegend的padding,配置方式与图表的padding一致legend.leftlegend离容器左侧的距离,其值可以为具体的像素值(20)或百分比(20%)、left或者rightlegend.toplegend离容器顶部的距离,暂仅支持数值形式
series图表的数据项列表series.name图表的名称,与legend.data对应,两者只只设置其一series.type图表的展示类型,暂支持line,bar以及pie,需要注意pie只能单独使用series.radius饼图的半径值,如50%,默认为40%series.yAxisIndex该数据项使用的y轴,默认为0,对yAxis的配置对应series.label.show是否显示文本标签(默认为对应的值)series.label.distance距离图形元素的距离series.label.color文本标签的颜色series.itemStyle.color该数据项展示时使用的颜色series.data数据项对应的数据数组,支持以下形式的数据:数值常用形式,数组数据为浮点数组,如[1.1, 2,3, 5.2]结构体pie图表或bar图表中指定样式使用,如[{"value": 1048, "name": "Search Engine"},{"value": 735,"name": "Direct"}]
children嵌套的子图表参数列表,图表支持嵌套的形式非echarts配置]
性能
简单的图表生成PNG在20ms左右,而SVG的性能则更快,性能上比起使用chrome headless加载echarts图表展示页面再截图生成的方式大幅度提升,满足简单的图表生成需求。
BenchmarkMultiChartPNGRender-8                78          15216336 ns/op         2298308 B/op       1148 allocs/op
BenchmarkMultiChartSVGRender-8               367           3356325 ns/op        20597282 B/op       3088 allocs/op
中文字符
默认使用的字符为roboto为英文字体库,因此如果需要显示中文字符需要增加中文字体库,InstallFont函数可添加对应的字体库,成功添加之后则指定title.textStyle.fontFamily即可。
在浏览器中使用svg时,如果指定的fontFamily不支持中文字符,展示的中文并不会乱码,但是会导致在计算字符宽度等错误。