# go-charts
[](https://github.com/vicanso/go-charts/blob/master/LICENSE)
[](https://github.com/vicanso/go-charts/actions)
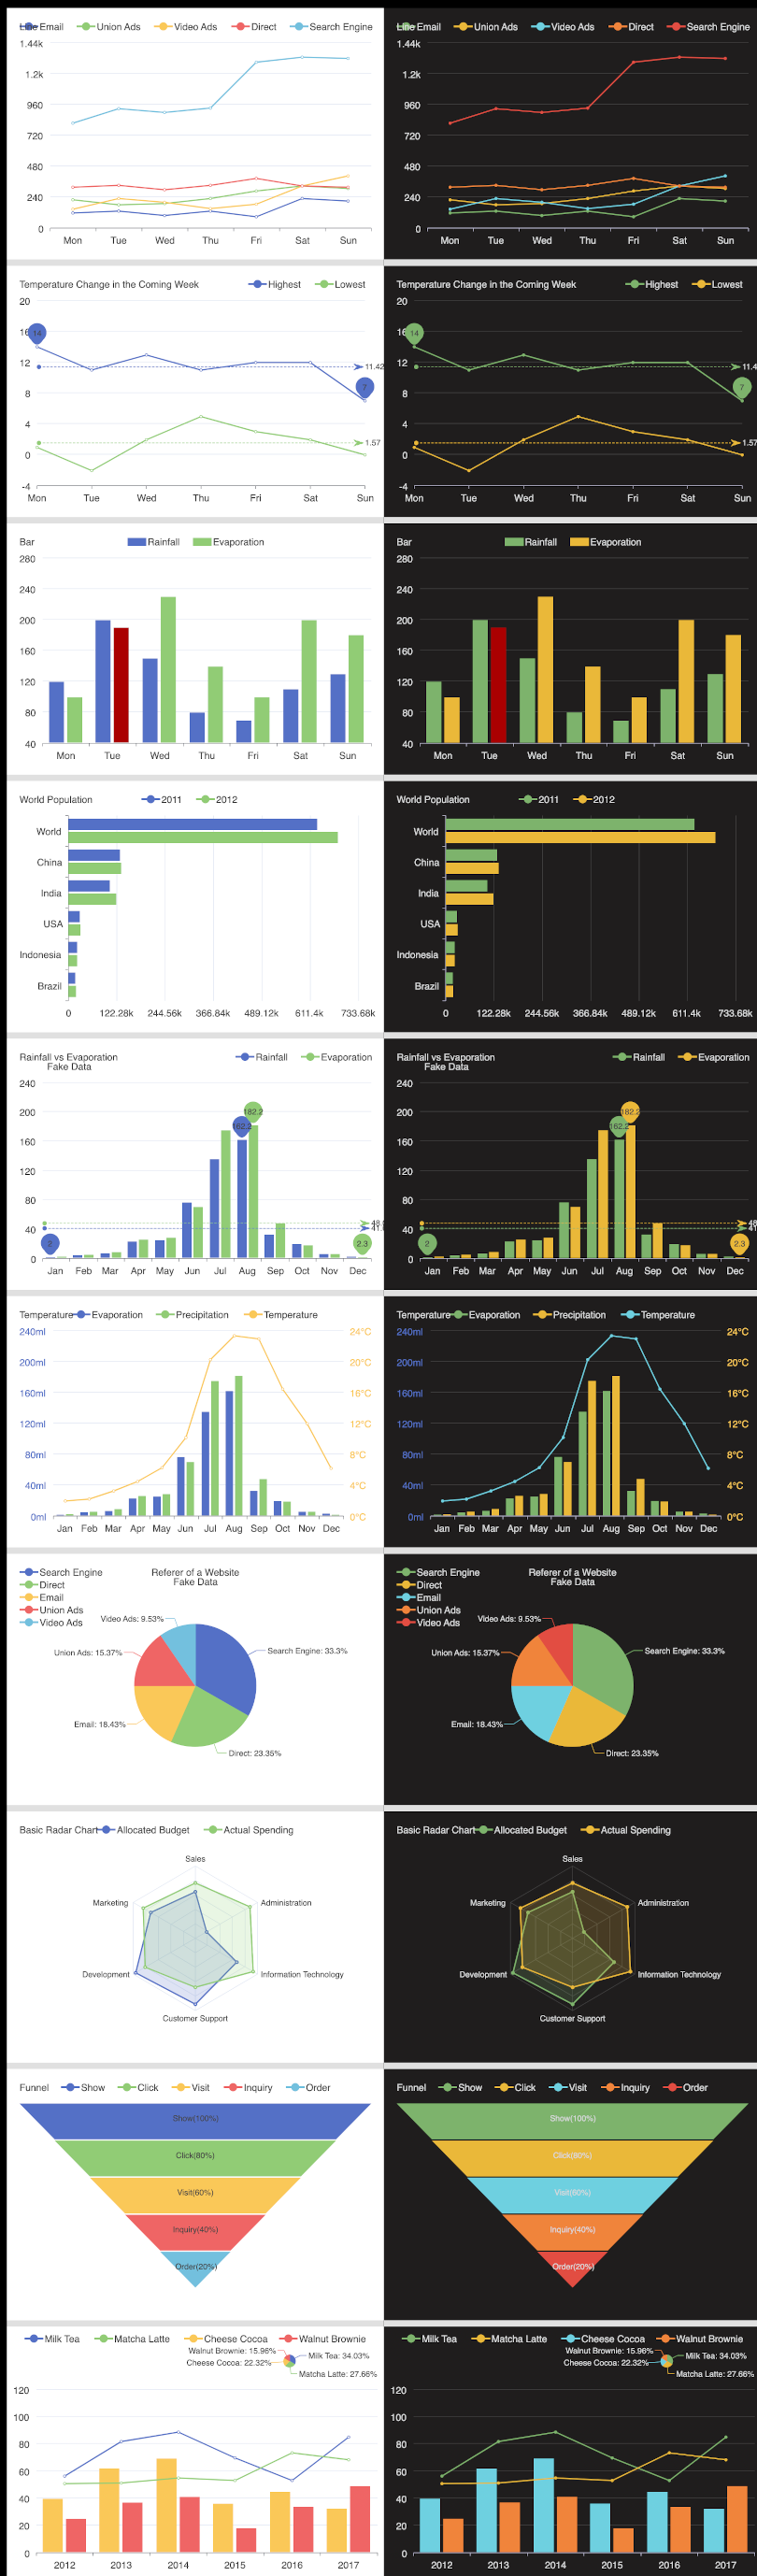
`go-charts`基于[go-chart](https://github.com/wcharczuk/go-chart),更简单方便的形式生成数据图表,支持`svg`与`png`两种方式的输出,支持主题`light`, `dark`, `grafana`以及`ant`。默认的输入格式为`png`,默认主题为`light`。
`Apache ECharts`在前端开发中得到众多开发者的认可,因此`go-charts`提供了兼容`Apache ECharts`的配置参数,简单快捷的生成相似的图表(`svg`或`png`),方便插入至Email或分享使用。下面为常用的图表截图(主题为light与grafana):