# go-charts
Clone from https://github.com/vicanso/go-charts
[](https://github.com/vicanso/go-charts/blob/master/LICENSE)
[](https://github.com/vicanso/go-charts/actions)
[中文](./README_zh.md)
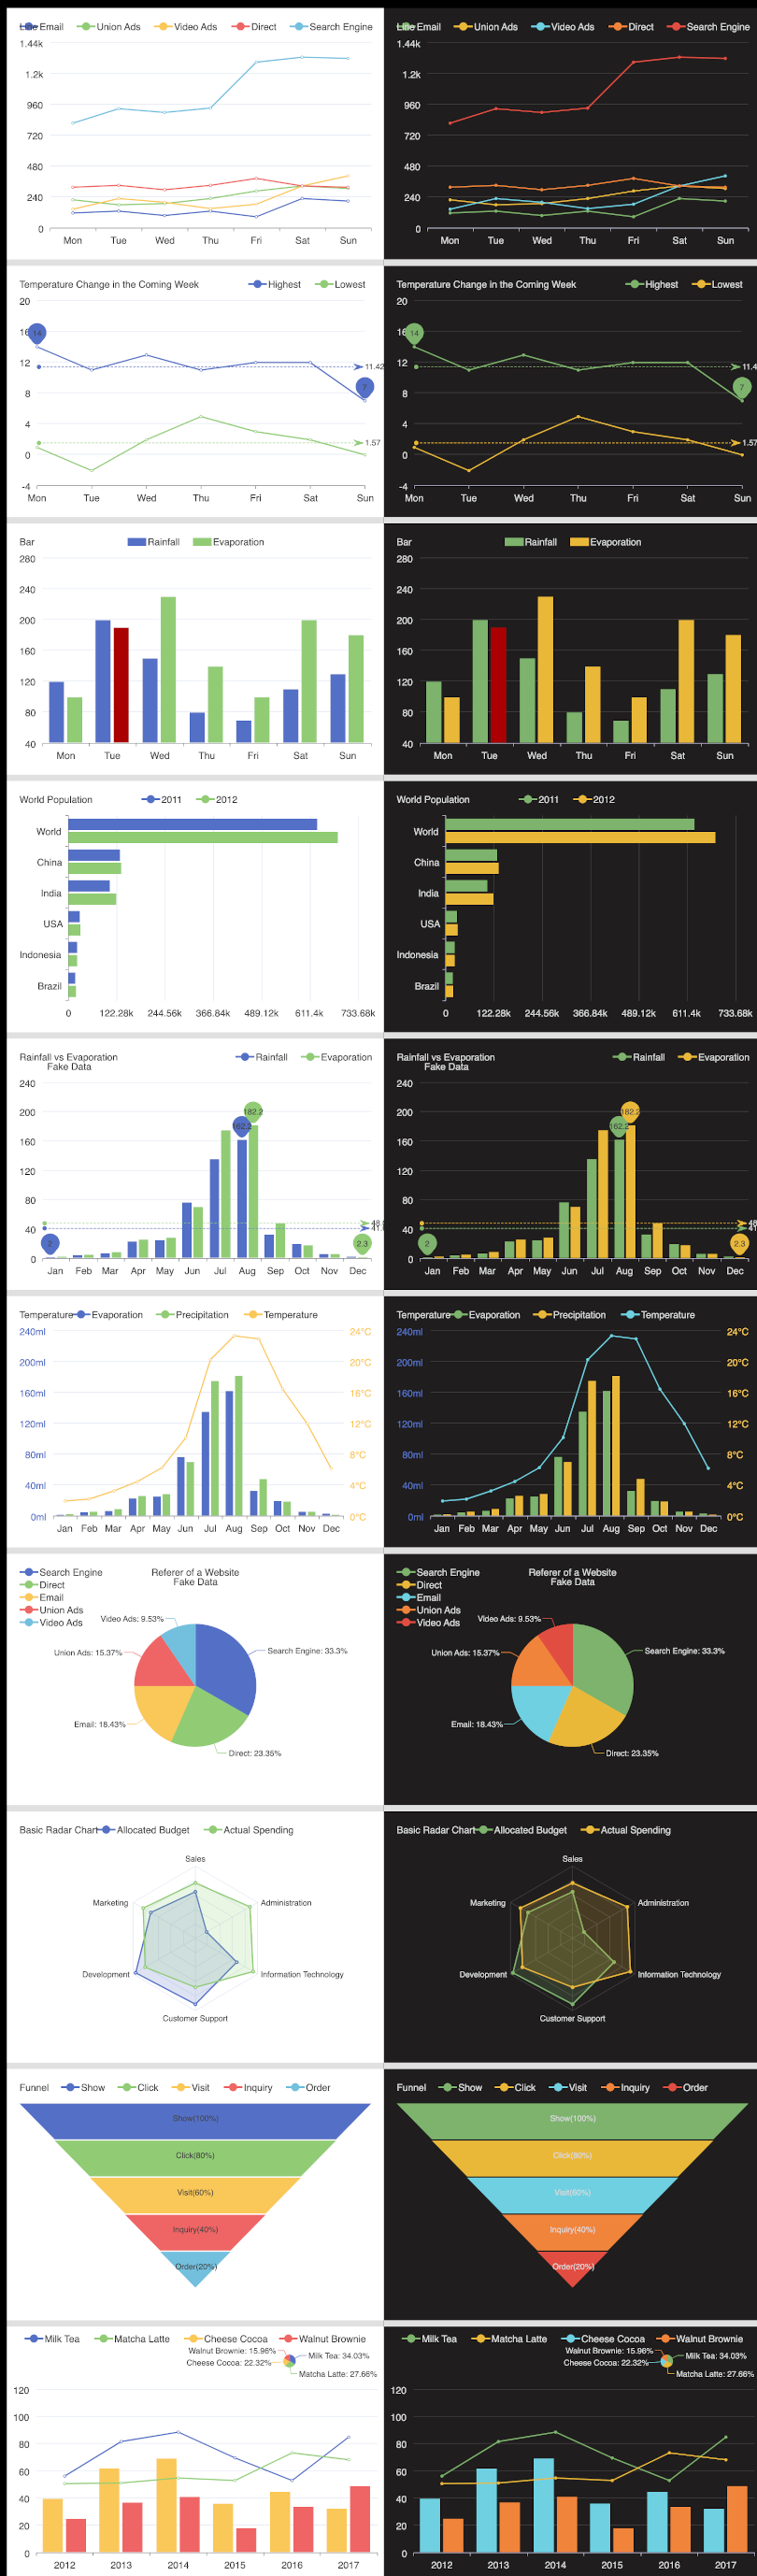
`go-charts` base on [go-chart](https://github.com/wcharczuk/go-chart),it is simpler way for generating charts, which supports `svg` and `png` format and themes: `light`, `dark`, `grafana` and `ant`. The default format is `png` and the default theme is `light`.
`Apache ECharts` is popular among Front-end developers, so `go-charts` supports the option of `Apache ECharts`. Developers can generate charts almost the same as `Apache ECharts`.
Screenshot of common charts, the left part is light theme, the right part is grafana theme.
## Chart Type
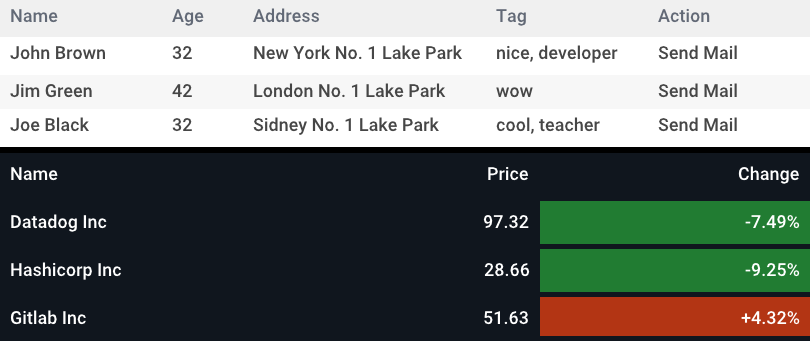
These chart types are supported: `line`, `bar`, `horizontal bar`, `pie`, `radar` or `funnel` and `table`.
## Example
More examples can be found in the [./examples/](./examples/) directory.
### Line Chart
```go
package main
import (
charts "git.smarteching.com/zeni/go-charts/v2"
)
func main() {
values := [][]float64{
{
120,
132,
101,
134,
90,
230,
210,
},
{
// snip...
},
{
// snip...
},
{
// snip...
},
{
// snip...
},
}
p, err := charts.LineRender(
values,
charts.TitleTextOptionFunc("Line"),
charts.XAxisDataOptionFunc([]string{
"Mon",
"Tue",
"Wed",
"Thu",
"Fri",
"Sat",
"Sun",
}),
charts.LegendLabelsOptionFunc([]string{
"Email",
"Union Ads",
"Video Ads",
"Direct",
"Search Engine",
}, charts.PositionCenter),
)
if err != nil {
panic(err)
}
buf, err := p.Bytes()
if err != nil {
panic(err)
}
// snip...
}
```
### Bar Chart
```go
package main
import (
"git.smarteching.com/zeni/go-charts/v2"
)
func main() {
values := [][]float64{
{
2.0,
4.9,
7.0,
23.2,
25.6,
76.7,
135.6,
162.2,
32.6,
20.0,
6.4,
3.3,
},
{
// snip...
},
}
p, err := charts.BarRender(
values,
charts.XAxisDataOptionFunc([]string{
"Jan",
"Feb",
"Mar",
"Apr",
"May",
"Jun",
"Jul",
"Aug",
"Sep",
"Oct",
"Nov",
"Dec",
}),
charts.LegendLabelsOptionFunc([]string{
"Rainfall",
"Evaporation",
}, charts.PositionRight),
charts.MarkLineOptionFunc(0, charts.SeriesMarkDataTypeAverage),
charts.MarkPointOptionFunc(0, charts.SeriesMarkDataTypeMax,
charts.SeriesMarkDataTypeMin),
// custom option func
func(opt *charts.ChartOption) {
opt.SeriesList[1].MarkPoint = charts.NewMarkPoint(
charts.SeriesMarkDataTypeMax,
charts.SeriesMarkDataTypeMin,
)
opt.SeriesList[1].MarkLine = charts.NewMarkLine(
charts.SeriesMarkDataTypeAverage,
)
},
)
if err != nil {
panic(err)
}
buf, err := p.Bytes()
if err != nil {
panic(err)
}
// snip...
}
```
### Horizontal Bar Chart
```go
package main
import (
"git.smarteching.com/zeni/go-charts/v2"
)
func main() {
values := [][]float64{
{
18203,
23489,
29034,
104970,
131744,
630230,
},
{
// snip...
},
}
p, err := charts.HorizontalBarRender(
values,
charts.TitleTextOptionFunc("World Population"),
charts.PaddingOptionFunc(charts.Box{
Top: 20,
Right: 40,
Bottom: 20,
Left: 20,
}),
charts.LegendLabelsOptionFunc([]string{
"2011",
"2012",
}),
charts.YAxisDataOptionFunc([]string{
"Brazil",
"Indonesia",
"USA",
"India",
"China",
"World",
}),
)
if err != nil {
panic(err)
}
buf, err := p.Bytes()
if err != nil {
panic(err)
}
// snip...
}
```
### Pie Chart
```go
package main
import (
"git.smarteching.com/zeni/go-charts/v2"
)
func main() {
values := []float64{
1048,
735,
580,
484,
300,
}
p, err := charts.PieRender(
values,
charts.TitleOptionFunc(charts.TitleOption{
Text: "Rainfall vs Evaporation",
Subtext: "Fake Data",
Left: charts.PositionCenter,
}),
charts.PaddingOptionFunc(charts.Box{
Top: 20,
Right: 20,
Bottom: 20,
Left: 20,
}),
charts.LegendOptionFunc(charts.LegendOption{
Orient: charts.OrientVertical,
Data: []string{
"Search Engine",
"Direct",
"Email",
"Union Ads",
"Video Ads",
},
Left: charts.PositionLeft,
}),
charts.PieSeriesShowLabel(),
)
if err != nil {
panic(err)
}
buf, err := p.Bytes()
if err != nil {
panic(err)
}
// snip...
}
```
### Radar Chart
```go
package main
import (
"git.smarteching.com/zeni/go-charts/v2"
)
func main() {
values := [][]float64{
{
4200,
3000,
20000,
35000,
50000,
18000,
},
{
// snip...
},
}
p, err := charts.RadarRender(
values,
charts.TitleTextOptionFunc("Basic Radar Chart"),
charts.LegendLabelsOptionFunc([]string{
"Allocated Budget",
"Actual Spending",
}),
charts.RadarIndicatorOptionFunc([]string{
"Sales",
"Administration",
"Information Technology",
"Customer Support",
"Development",
"Marketing",
}, []float64{
6500,
16000,
30000,
38000,
52000,
25000,
}),
)
if err != nil {
panic(err)
}
buf, err := p.Bytes()
if err != nil {
panic(err)
}
// snip...
}
```
### Funnel Chart
```go
package main
import (
"git.smarteching.com/zeni/go-charts/v2"
)
func main() {
values := []float64{
100,
80,
60,
40,
20,
}
p, err := charts.FunnelRender(
values,
charts.TitleTextOptionFunc("Funnel"),
charts.LegendLabelsOptionFunc([]string{
"Show",
"Click",
"Visit",
"Inquiry",
"Order",
}),
)
if err != nil {
panic(err)
}
buf, err := p.Bytes()
if err != nil {
panic(err)
}
// snip...
}
```
### Table
```go
package main
import (
"git.smarteching.com/zeni/go-charts/v2"
)
func main() {
header := []string{
"Name",
"Age",
"Address",
"Tag",
"Action",
}
data := [][]string{
{
"John Brown",
"32",
"New York No. 1 Lake Park",
"nice, developer",
"Send Mail",
},
{
"Jim Green ",
"42",
"London No. 1 Lake Park",
"wow",
"Send Mail",
},
{
"Joe Black ",
"32",
"Sidney No. 1 Lake Park",
"cool, teacher",
"Send Mail",
},
}
spans := map[int]int{
0: 2,
1: 1,
// 设置第三列的span
2: 3,
3: 2,
4: 2,
}
p, err := charts.TableRender(
header,
data,
spans,
)
if err != nil {
panic(err)
}
buf, err := p.Bytes()
if err != nil {
panic(err)
}
// snip...
}
```
### ECharts Render
```go
package main
import (
"git.smarteching.com/zeni/go-charts/v2"
)
func main() {
buf, err := charts.RenderEChartsToPNG(`{
"title": {
"text": "Line"
},
"xAxis": {
"data": ["Mon", "Tue", "Wed", "Thu", "Fri", "Sat", "Sun"]
},
"series": [
{
"data": [150, 230, 224, 218, 135, 147, 260]
}
]
}`)
// snip...
}
```
## ECharts Option
The name with `[]` is new parameter, others are the same as `echarts`.
- `[type]` The canvas type, support `svg` and `png`, default is `svg`
- `[theme]` The theme, support `dark`, `light` and `grafana`, default is `light`
- `[fontFamily]` The font family for chart
- `[padding]` The padding of chart
- `[box]` The canvas box of chart
- `[width]` The width of chart
- `[height]` The height of chart
- `title` Title component, including main title and subtitle
- `title.text` The main title text, supporting for \n for newlines
- `title.subtext`Subtitle text, supporting for \n for newlines
- `title.left` Distance between title component and the left side of the container. Left value can be instant pixel value like 20; it can also be a percentage value relative to container width like '20%'; and it can also be 'left', 'center', or 'right'.
- `title.top` Distance between title component and the top side of the container. Top value can be instant pixel value like 20
- `title.textStyle.color` Text color for title
- `title.textStyle.fontSize` Text font size for title
- `title.textStyle.fontFamily` Text font family for title, it will change the font family for chart
- `xAxis` The x axis in cartesian(rectangular) coordinate. `go-charts` only support one x axis.
- `xAxis.boundaryGap` The boundary gap on both sides of a coordinate axis. The setting and behavior of category axes and non-category axes are different. If set `null` or `true`, the label appear in the center part of two axis ticks.
- `xAxis.splitNumber` Number of segments that the axis is split into. Note that this number serves only as a recommendation, and the true segments may be adjusted based on readability
- `xAxis.data` Category data, only support string array.
- `yAxis` The y axis in cartesian(rectangular) coordinate, it support 2 y axis
- `yAxis.min` The minimum value of axis. It will be automatically computed to make sure axis tick is equally distributed when not set
- `yAxis.max` The maximum value of axis. It will be automatically computed to make sure axis tick is equally distributed when not se.
- `yAxis.axisLabel.formatter` Formatter of axis label, which supports string template: `"formatter": "{value} kg"`
- `yAxis.axisLine.lineStyle.color` The color for line
- `legend` Legend component
- `legend.show` Whether to show legend
- `legend.data` Data array of legend, only support string array: ["Email", "Video Ads"]
- `legend.align` Legend marker and text aligning. Support `left` and `right`, default is `left`
- `legend.padding` legend space around content
- `legend.left` Distance between legend component and the left side of the container. Left value can be instant pixel value like 20; it can also be a percentage value relative to container width like '20%'; and it can also be 'left', 'center', or 'right'.
- `legend.top` Distance between legend component and the top side of the container. Top value can be instant pixel value like 20
- `radar` Coordinate for radar charts
- `radar.indicator` Indicator of radar chart, which is used to assign multiple variables(dimensions) in radar chart
- `radar.indicator.name` Indicator's name
- `radar.indicator.max` The maximum value of indicator
- `radar.indicator.min` The minimum value of indicator, default value is 0.
- `series` The series for chart
- `series.name` Series name used for displaying in legend.
- `series.type` Series type: `line`, `bar`, `pie`, `radar` or `funnel`
- `series.radius` Radius of Pie chart:`50%`, default is `40%`
- `series.yAxisIndex` Index of y axis to combine with, which is useful for multiple y axes in one chart
- `series.label.show` Whether to show label
- `series.label.distance` Distance to the host graphic element
- `series.label.color` Label color
- `series.itemStyle.color` Color for the series's item
- `series.markPoint` Mark point in a chart.
- `series.markPoint.symbolSize` Symbol size, default is `30`
- `series.markPoint.data` Data array for mark points, each of which is an object and the type only support `max` and `min`: `[{"type": "max"}, {"type": "min"}]`
- `series.markLine` Mark line in a chart
- `series.markPoint.data` Data array for mark points, each of which is an object and the type only support `max`, `min` and `average`: `[{"type": "max"}, {"type": "min"}, {"type": "average"}]``
- `series.data` Data array of series, which can be in the following forms:
- `value` It's a float array: [1.1, 2,3, 5.2]
- `object` It's a object value array: [{"value": 1048, "name": "Search Engine"},{"value": 735,"name": "Direct"}]
- `[children]` The options of children chart
## Performance
Generate a png chart will be less than 20ms. It's better than using `chrome headless` with `echarts`.
```bash
BenchmarkMultiChartPNGRender-8 78 15216336 ns/op 2298308 B/op 1148 allocs/op
BenchmarkMultiChartSVGRender-8 367 3356325 ns/op 20597282 B/op 3088 allocs/op
```